

Integrated packaging solutions provider Sealed Air Corporation (NYSE:SEE) beat Wall Street’s revenue expectations in Q2 CY2025, but sales were flat year on year at $1.34 billion. The company expects the full year’s revenue to be around $5.3 billion, close to analysts’ estimates. Its non-GAAP profit of $0.89 per share was 23.8% above analysts’ consensus estimates.
Is now the time to buy Sealed Air? Find out by accessing our full research report, it’s free.
Sealed Air (SEE) Q2 CY2025 Highlights:
- Revenue: $1.34 billion vs analyst estimates of $1.31 billion (flat year on year, 1.9% beat)
- Adjusted EPS: $0.89 vs analyst estimates of $0.72 (23.8% beat)
- Adjusted EBITDA: $293 million vs analyst estimates of $270.7 million (21.9% margin, 8.2% beat)
- The company reconfirmed its revenue guidance for the full year of $5.3 billion at the midpoint
- Management reiterated its full-year Adjusted EPS guidance of $3.10 at the midpoint
- EBITDA guidance for the full year is $1.13 billion at the midpoint, above analyst estimates of $1.11 billion
- Operating Margin: 14.9%, in line with the same quarter last year
- Free Cash Flow Margin: 6.9%, down from 9.6% in the same quarter last year
- Market Capitalization: $4.26 billion
Company Overview
Founded in 1960, Sealed Air Corporation (NYSE: SEE) specializes in the development and production of protective and food packaging solutions, serving a variety of industries.
Revenue Growth
Reviewing a company’s long-term sales performance reveals insights into its quality. Any business can experience short-term success, but top-performing ones enjoy sustained growth for years. Unfortunately, Sealed Air’s 1.9% annualized revenue growth over the last five years was sluggish. This was below our standards and is a poor baseline for our analysis.
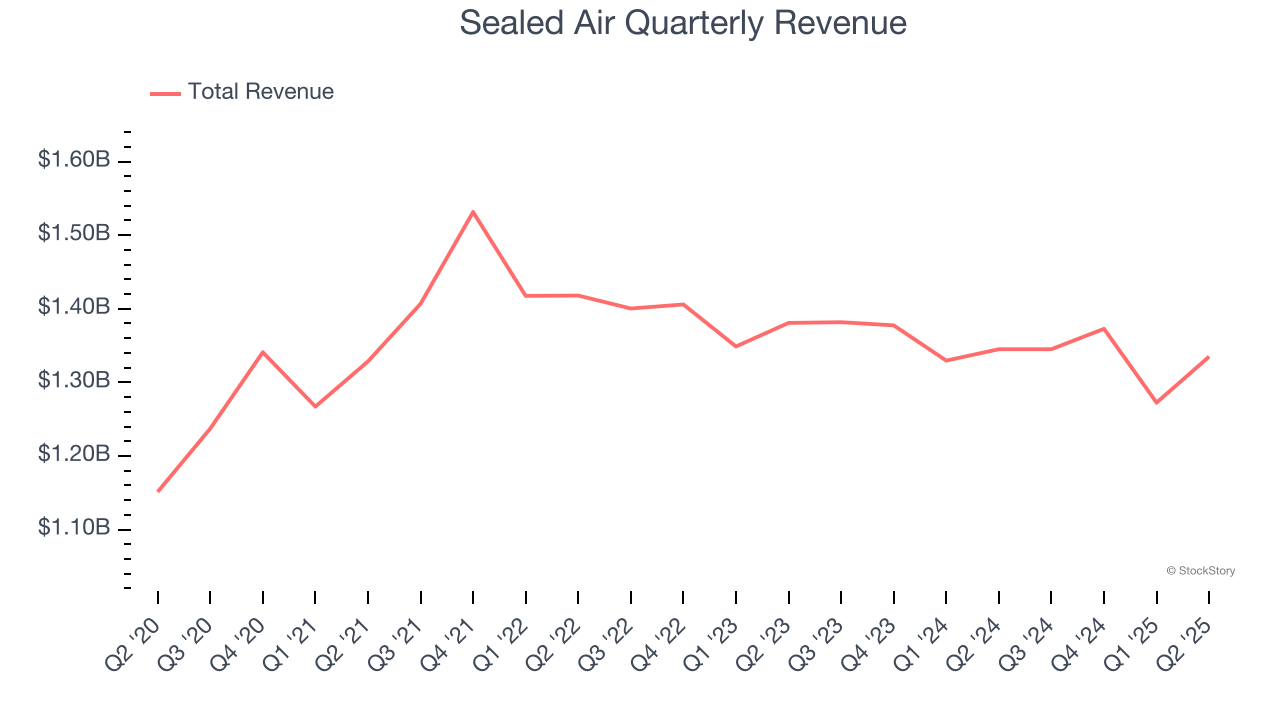
We at StockStory place the most emphasis on long-term growth, but within industrials, a half-decade historical view may miss cycles, industry trends, or a company capitalizing on catalysts such as a new contract win or a successful product line. Sealed Air’s performance shows it grew in the past but relinquished its gains over the last two years, as its revenue fell by 1.9% annually. Sealed Air isn’t alone in its struggles as the Industrial Packaging industry experienced a cyclical downturn, with many similar businesses observing lower sales at this time. 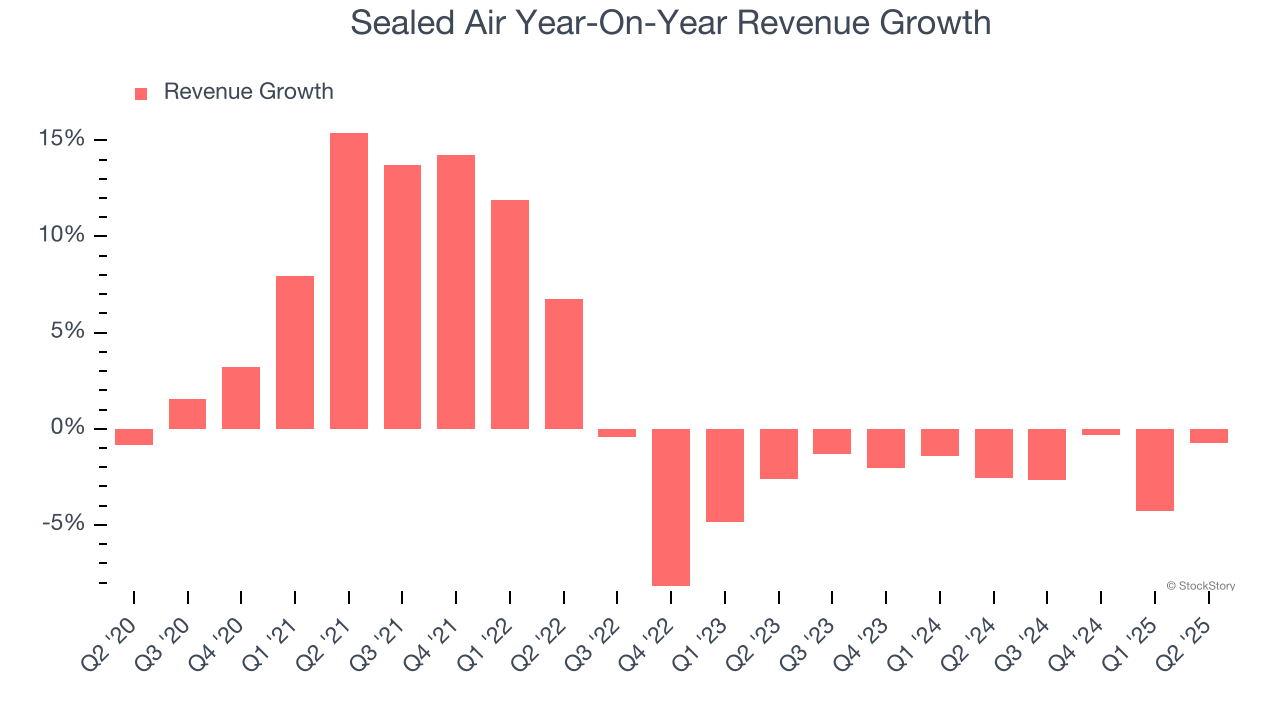
This quarter, Sealed Air’s $1.34 billion of revenue was flat year on year but beat Wall Street’s estimates by 1.9%.
Looking ahead, sell-side analysts expect revenue to remain flat over the next 12 months. Although this projection implies its newer products and services will spur better top-line performance, it is still below the sector average.
Software is eating the world and there is virtually no industry left that has been untouched by it. That drives increasing demand for tools helping software developers do their jobs, whether it be monitoring critical cloud infrastructure, integrating audio and video functionality, or ensuring smooth content streaming. Click here to access a free report on our 3 favorite stocks to play this generational megatrend.
Operating Margin
Sealed Air has been an efficient company over the last five years. It was one of the more profitable businesses in the industrials sector, boasting an average operating margin of 15.2%.
Analyzing the trend in its profitability, Sealed Air’s operating margin decreased by 2.1 percentage points over the last five years. Many Industrial Packaging companies also saw their margins fall (along with revenue, as mentioned above) because the cycle turned in the wrong direction. We hope Sealed Air can emerge from this a stronger company, as the silver lining of a downturn is that market share can be won and efficiencies found.
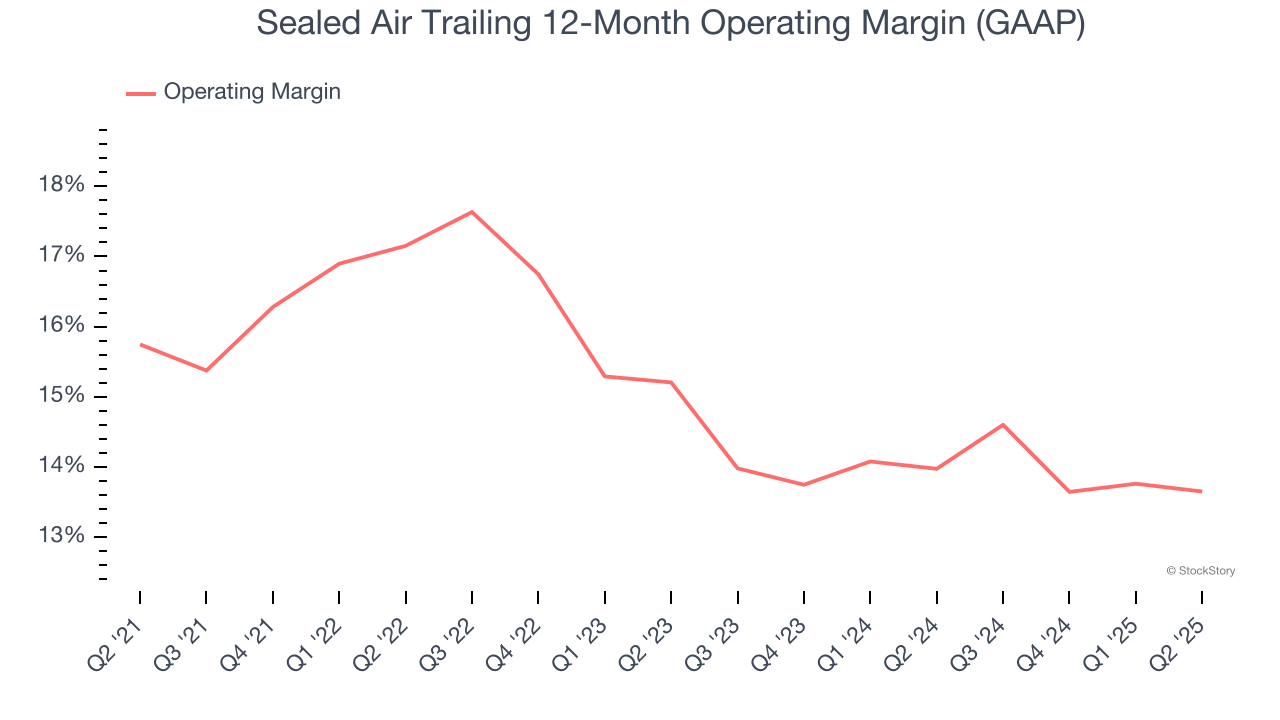
This quarter, Sealed Air generated an operating margin profit margin of 14.9%, in line with the same quarter last year. This indicates the company’s cost structure has recently been stable.
Earnings Per Share
Revenue trends explain a company’s historical growth, but the long-term change in earnings per share (EPS) points to the profitability of that growth – for example, a company could inflate its sales through excessive spending on advertising and promotions.
Sealed Air’s weak 2.1% annual EPS growth over the last five years aligns with its revenue performance. This tells us it maintained its per-share profitability as it expanded.
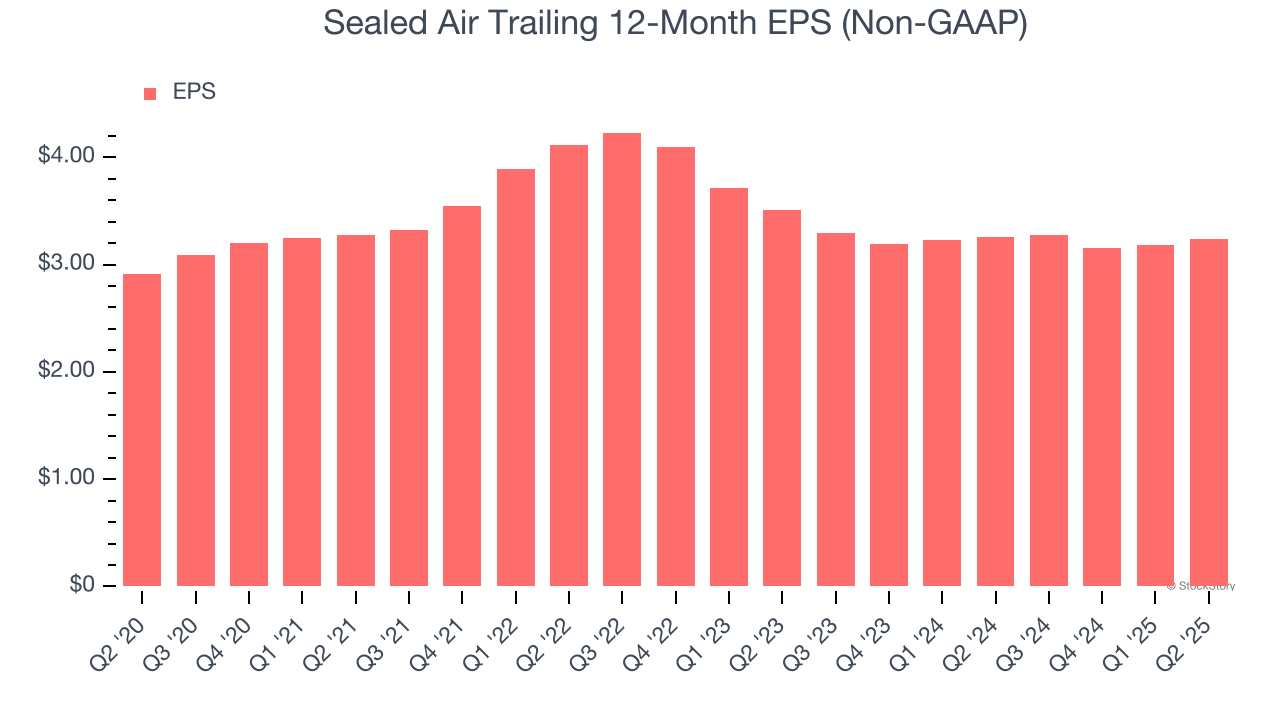
Like with revenue, we analyze EPS over a more recent period because it can provide insight into an emerging theme or development for the business.
For Sealed Air, its two-year annual EPS declines of 3.9% show it’s continued to underperform. These results were bad no matter how you slice the data.
In Q2, Sealed Air reported adjusted EPS at $0.89, up from $0.83 in the same quarter last year. This print easily cleared analysts’ estimates, and shareholders should be content with the results. Over the next 12 months, Wall Street expects Sealed Air’s full-year EPS of $3.24 to shrink by 5.2%.
Key Takeaways from Sealed Air’s Q2 Results
We were impressed by how significantly Sealed Air blew past analysts’ EBITDA expectations this quarter. We were also glad its EPS outperformed Wall Street’s estimates. Zooming out, we think this was a solid print. The stock traded up 7.2% to $31.11 immediately following the results.
Sealed Air put up rock-solid earnings, but one quarter doesn’t necessarily make the stock a buy. Let’s see if this is a good investment. When making that decision, it’s important to consider its valuation, business qualities, as well as what has happened in the latest quarter. We cover that in our actionable full research report which you can read here, it’s free.