

Medical technology company Teleflex (NYSE:TFX) announced better-than-expected revenue in Q2 CY2025, with sales up 2.3% year on year to $780.9 million. Its non-GAAP profit of $3.73 per share was 10.8% above analysts’ consensus estimates.
Is now the time to buy Teleflex? Find out by accessing our full research report, it’s free.
Teleflex (TFX) Q2 CY2025 Highlights:
- Revenue: $780.9 million vs analyst estimates of $770.9 million (2.3% year-on-year growth, 1.3% beat)
- Adjusted EPS: $3.73 vs analyst estimates of $3.37 (10.8% beat)
- Management raised its full-year Adjusted EPS guidance to $14.10 at the midpoint, a 5.2% increase
- Operating Margin: 19.9%, up from 15.3% in the same quarter last year
- Free Cash Flow was -$26.78 million, down from $56.89 million in the same quarter last year
- Constant Currency Revenue rose 1% year on year, in line with the same quarter last year
- Market Capitalization: $5.03 billion
"We are pleased with our solid second quarter results, which reflected an increase in constant currency revenue growth and adjusted earnings per share compared to the prior year period," said Liam Kelly, Teleflex's Chairman, President and Chief Executive Officer.
Company Overview
With a portfolio spanning from vascular access catheters to minimally invasive surgical tools, Teleflex (NYSE:TFX) designs, manufactures, and supplies single-use medical devices used in critical care and surgical procedures across hospitals worldwide.
Revenue Growth
Reviewing a company’s long-term sales performance reveals insights into its quality. Any business can put up a good quarter or two, but the best consistently grow over the long haul. Unfortunately, Teleflex’s 3.8% annualized revenue growth over the last five years was tepid. This fell short of our benchmark for the healthcare sector and is a tough starting point for our analysis.
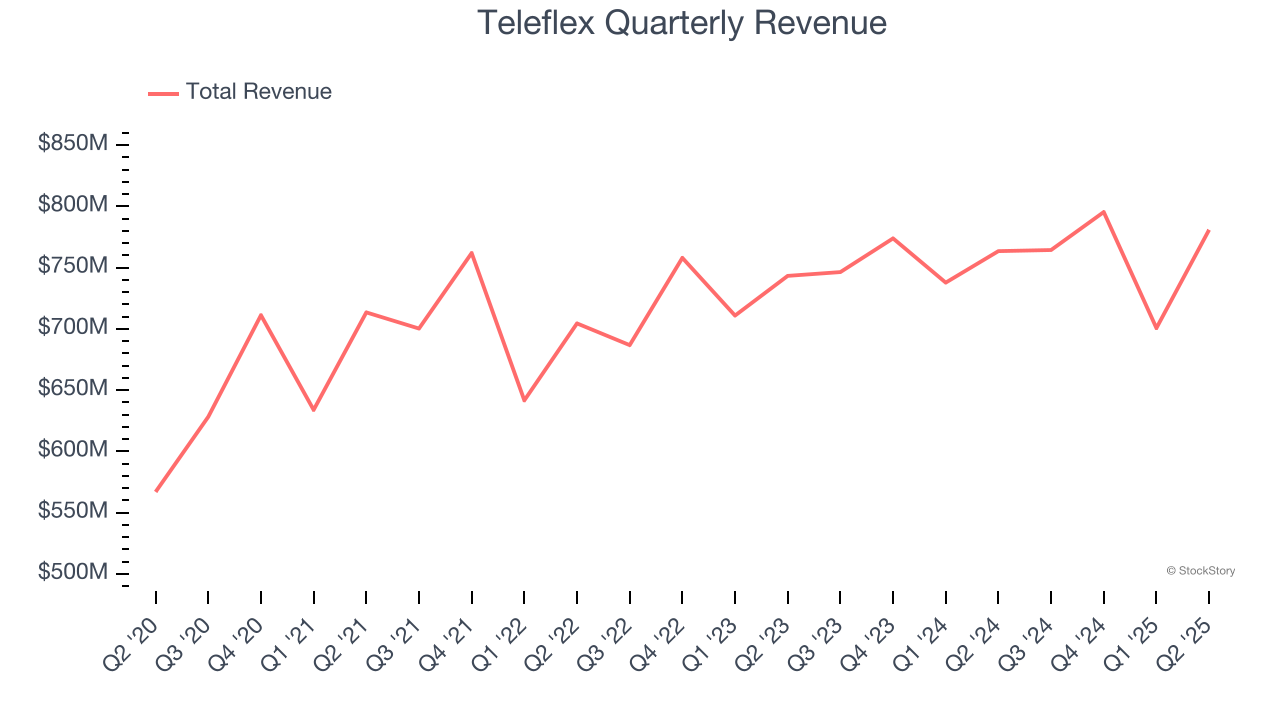
We at StockStory place the most emphasis on long-term growth, but within healthcare, a half-decade historical view may miss recent innovations or disruptive industry trends. Teleflex’s recent performance shows its demand has slowed as its annualized revenue growth of 2.4% over the last two years was below its five-year trend. 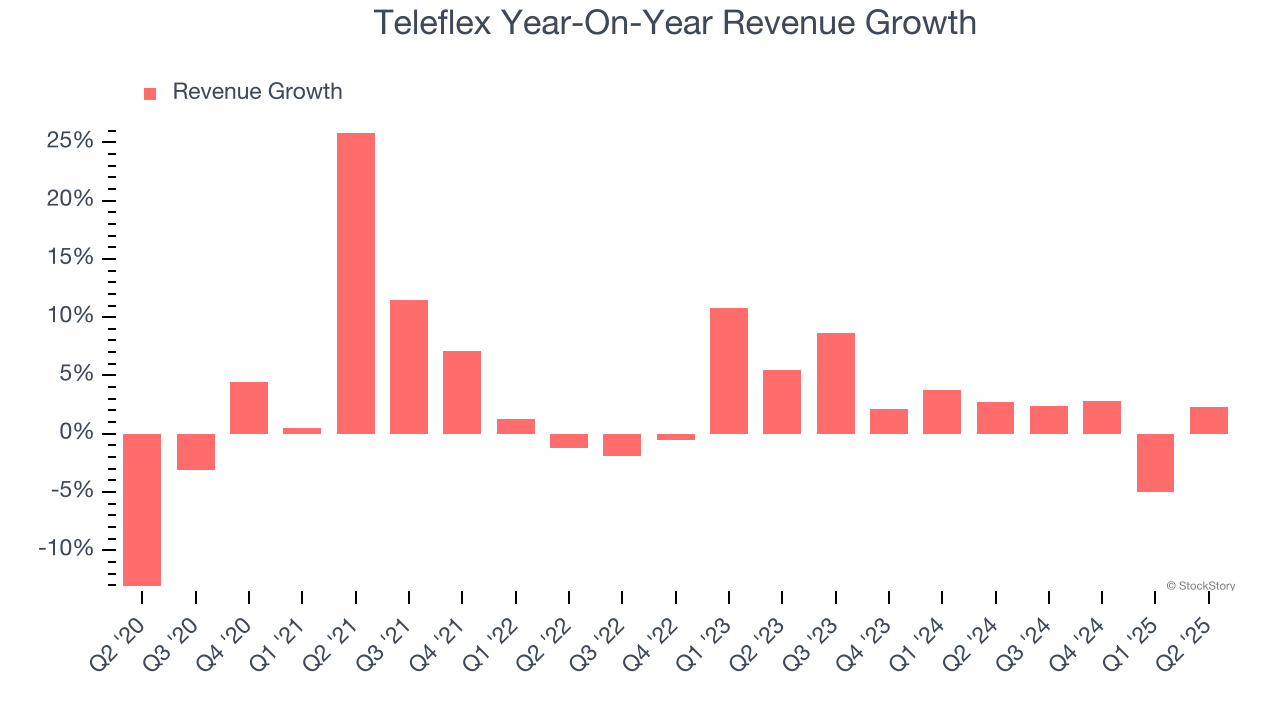
Teleflex also reports sales performance excluding currency movements, which are outside the company’s control and not indicative of demand. Over the last two years, its constant currency sales averaged 2% year-on-year growth. Because this number aligns with its normal revenue growth, we can see that Teleflex has properly hedged its foreign currency exposure. 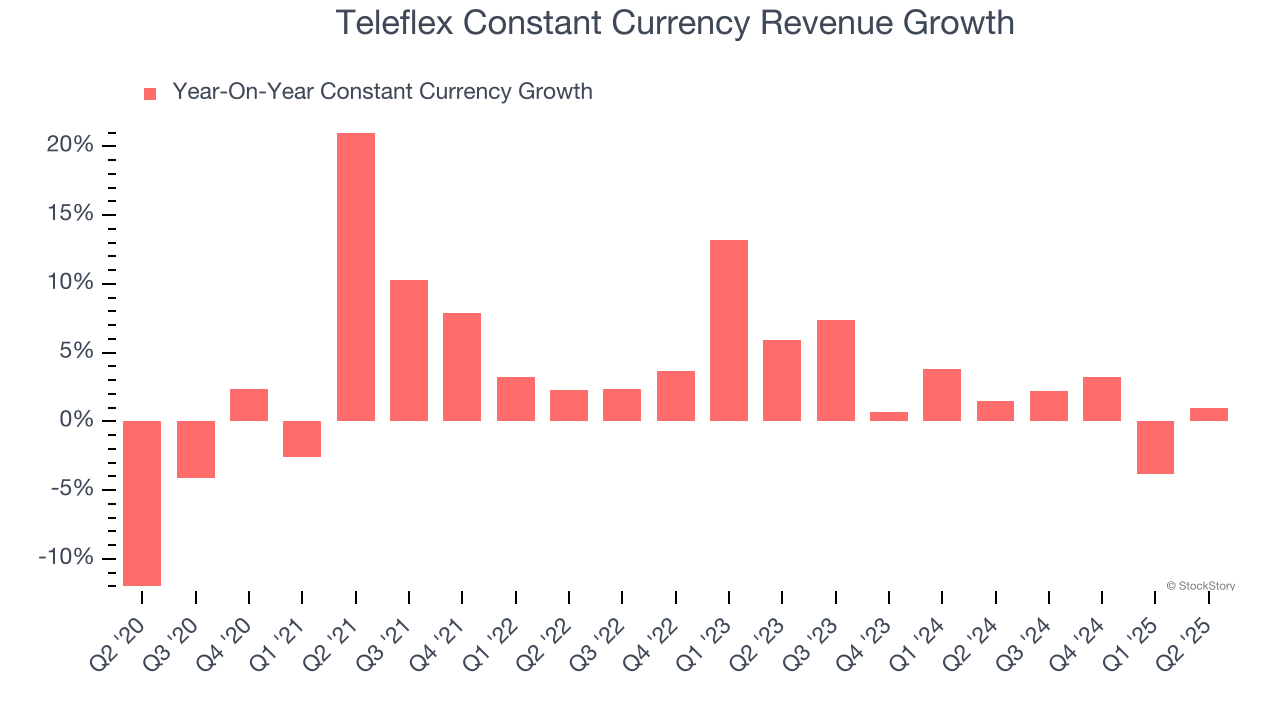
This quarter, Teleflex reported modest year-on-year revenue growth of 2.3% but beat Wall Street’s estimates by 1.3%.
Looking ahead, sell-side analysts expect revenue to grow 6.8% over the next 12 months, an improvement versus the last two years. This projection is above average for the sector and suggests its newer products and services will spur better top-line performance.
Unless you’ve been living under a rock, it should be obvious by now that generative AI is going to have a huge impact on how large corporations do business. While Nvidia and AMD are trading close to all-time highs, we prefer a lesser-known (but still profitable) stock benefiting from the rise of AI. Click here to access our free report one of our favorites growth stories.
Operating Margin
Operating margin is an important measure of profitability as it shows the portion of revenue left after accounting for all core expenses – everything from the cost of goods sold to advertising and wages. It’s also useful for comparing profitability across companies with different levels of debt and tax rates because it excludes interest and taxes.
Teleflex has managed its cost base well over the last five years. It demonstrated solid profitability for a healthcare business, producing an average operating margin of 15.9%.
Looking at the trend in its profitability, Teleflex’s operating margin decreased by 6.6 percentage points over the last five years. The company’s two-year trajectory also shows it failed to get its profitability back to the peak as its margin fell by 7.4 percentage points. This performance was poor no matter how you look at it - it shows its expenses were rising and it couldn’t pass those costs onto its customers.
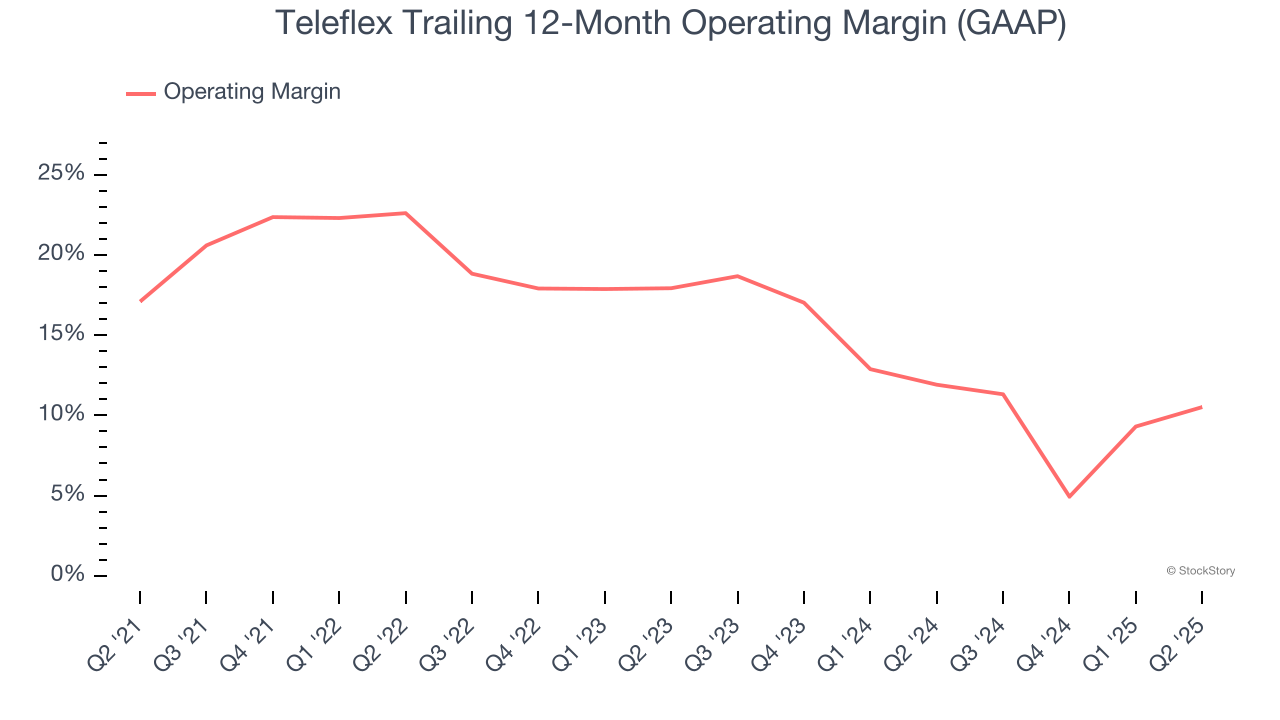
In Q2, Teleflex generated an operating margin profit margin of 19.9%, up 4.6 percentage points year on year. This increase was a welcome development and shows it was more efficient.
Earnings Per Share
Revenue trends explain a company’s historical growth, but the long-term change in earnings per share (EPS) points to the profitability of that growth – for example, a company could inflate its sales through excessive spending on advertising and promotions.
Teleflex’s decent 5.2% annual EPS growth over the last five years aligns with its revenue performance. This tells us its incremental sales were profitable.
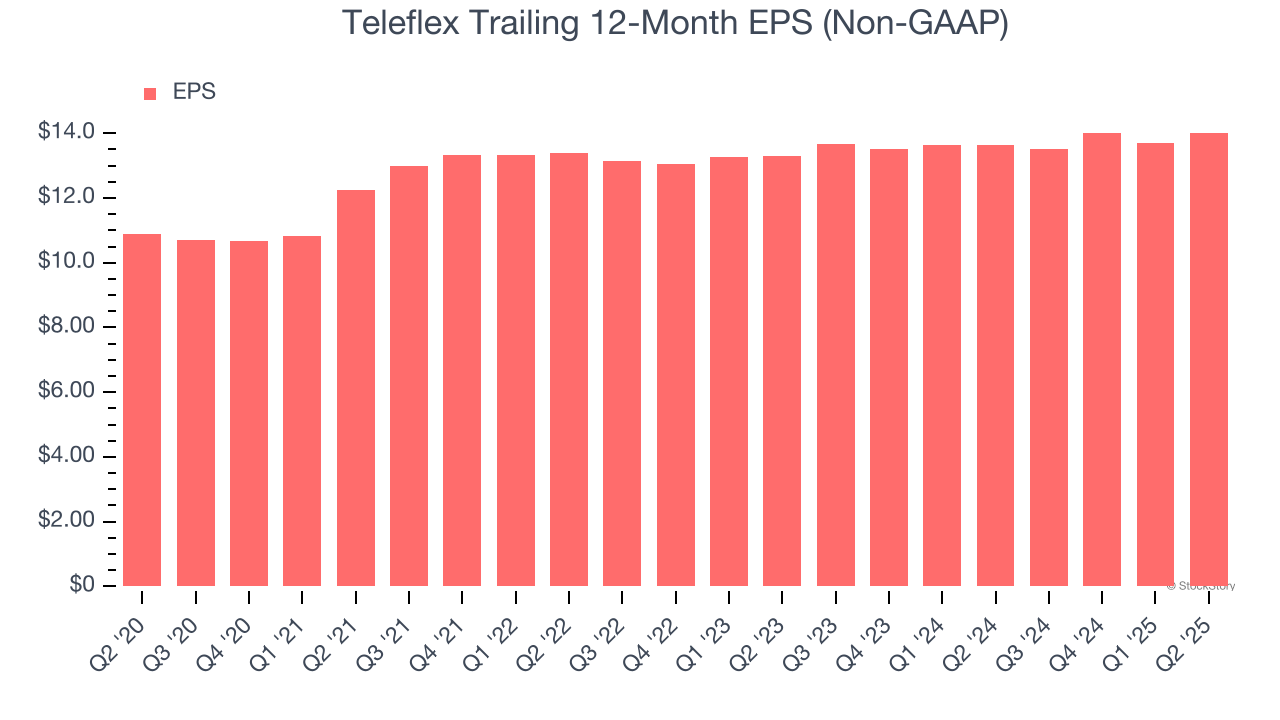
In Q2, Teleflex reported adjusted EPS at $3.73, up from $3.42 in the same quarter last year. This print easily cleared analysts’ estimates, and shareholders should be content with the results. Over the next 12 months, Wall Street expects Teleflex’s full-year EPS of $14.02 to shrink by 3.6%.
Key Takeaways from Teleflex’s Q2 Results
We were impressed by how significantly Teleflex blew past analysts’ full-year EPS guidance expectations this quarter. We were also happy its EPS outperformed Wall Street’s estimates. Overall, we think this was a solid quarter with some key areas of upside. The stock traded up 3.6% to $118.07 immediately following the results.
Teleflex put up rock-solid earnings, but one quarter doesn’t necessarily make the stock a buy. Let’s see if this is a good investment. When making that decision, it’s important to consider its valuation, business qualities, as well as what has happened in the latest quarter. We cover that in our actionable full research report which you can read here, it’s free.